Binance Research outlines 10 charts shaping crypto’s path in 2025

From rising ETF inflows to accelerating stablecoin use, Binance Research highlights 10 charts illustrating the structural drivers of crypto’s 2025 market cycle.
Binance Research has published its “10 Charts for 2025” report, offering data-backed insights into how liquidity, regulation, and institutional participation are reshaping the crypto landscape this year. The findings suggest a more mature, differently paced cycle compared with past bull runs.
2025: The year institutions finally showed up
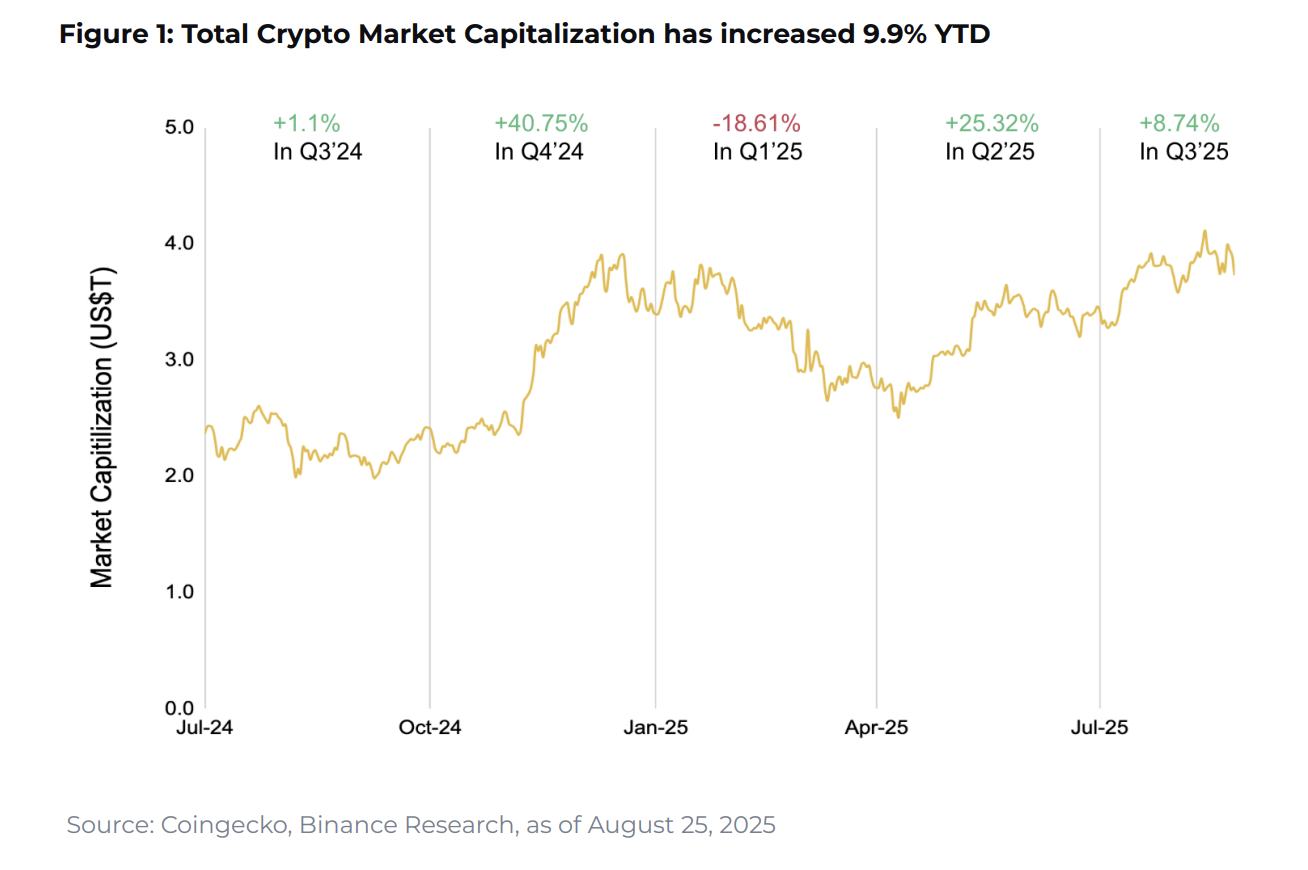
Crypto markets bounced back in 2025, up 9.9% this year with over $600 billion added to the total market cap. After a weak Q1, markets rebounded strongly in Q2 and kept momentum through Q3, with several major digital assets setting new all-time highs.
The report, authored by Macro Researcher Moulik Nagesh and Research Intern Asher Lin Jiayong, breaks down ten key charts showing what’s really moving crypto markets, from macro liquidity conditions to crypto-native developments in DeFi and tokenization.
Chart 1: Global liquidity reaches four-year peak
Global M2 liquidity has expanded to its highest level in four years, recording its strongest six-month increase since 2021 with a $5.6 trillion rise in broad money supply. All this extra money floating around has been good for Bitcoin and other risky assets.
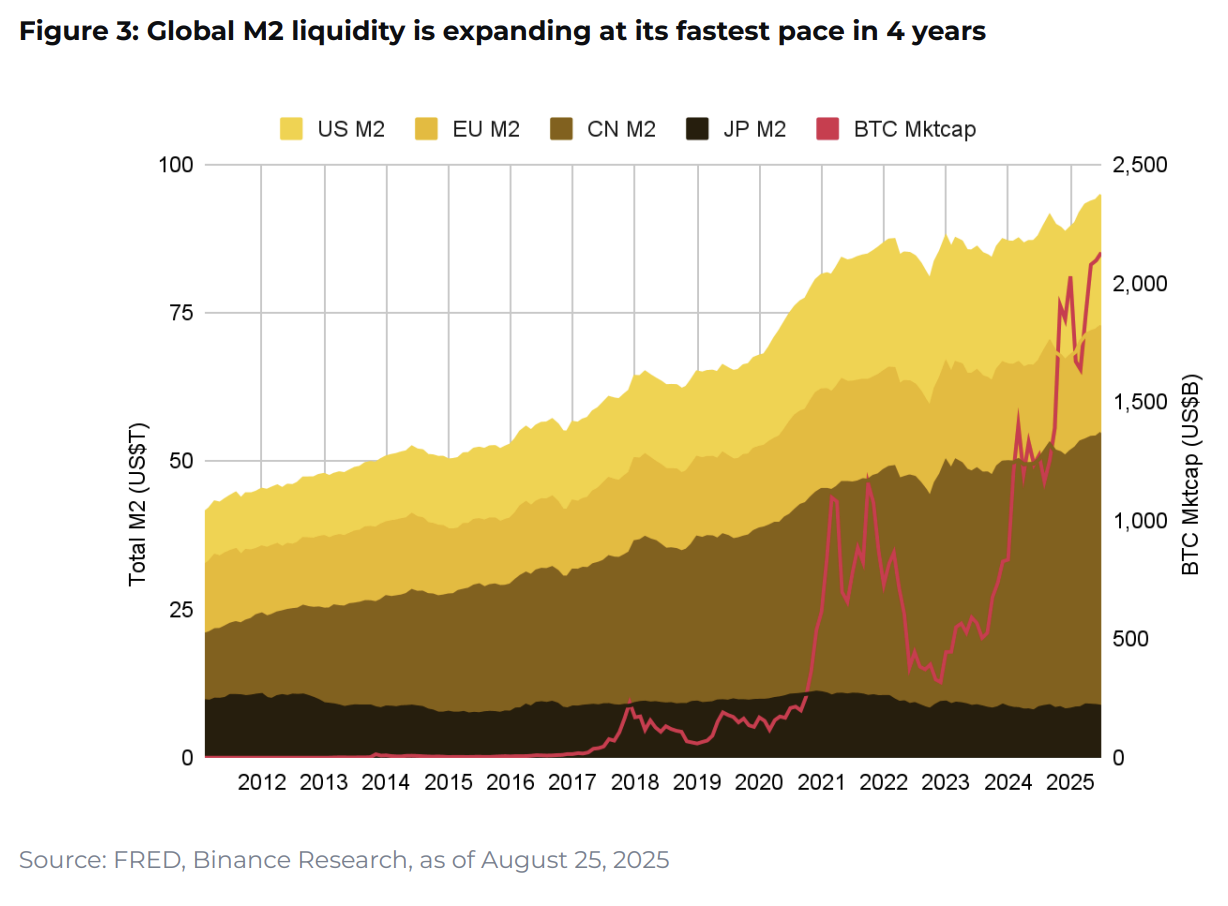
The Federal Reserve has effectively wound down quantitative tightening while maintaining a cautious stance, and other major economies continue accommodative policies. Fed Chair Powell’s recent Jackson Hole remarks about potential policy adjustments have set the stage for further liquidity support, particularly benefiting digital assets as investors rotate into risk-on positions.
Chart 2: BTC and ETH outperform traditional benchmarks
Ethereum gained 36%, leading all major assets. Bitcoin rose 18%, outperforming most equities and commodities. This performance highlights crypto’s evolving role in diversified portfolios, with Bitcoin demonstrating unique dual characteristics as both a macro hedge and risk-on asset.
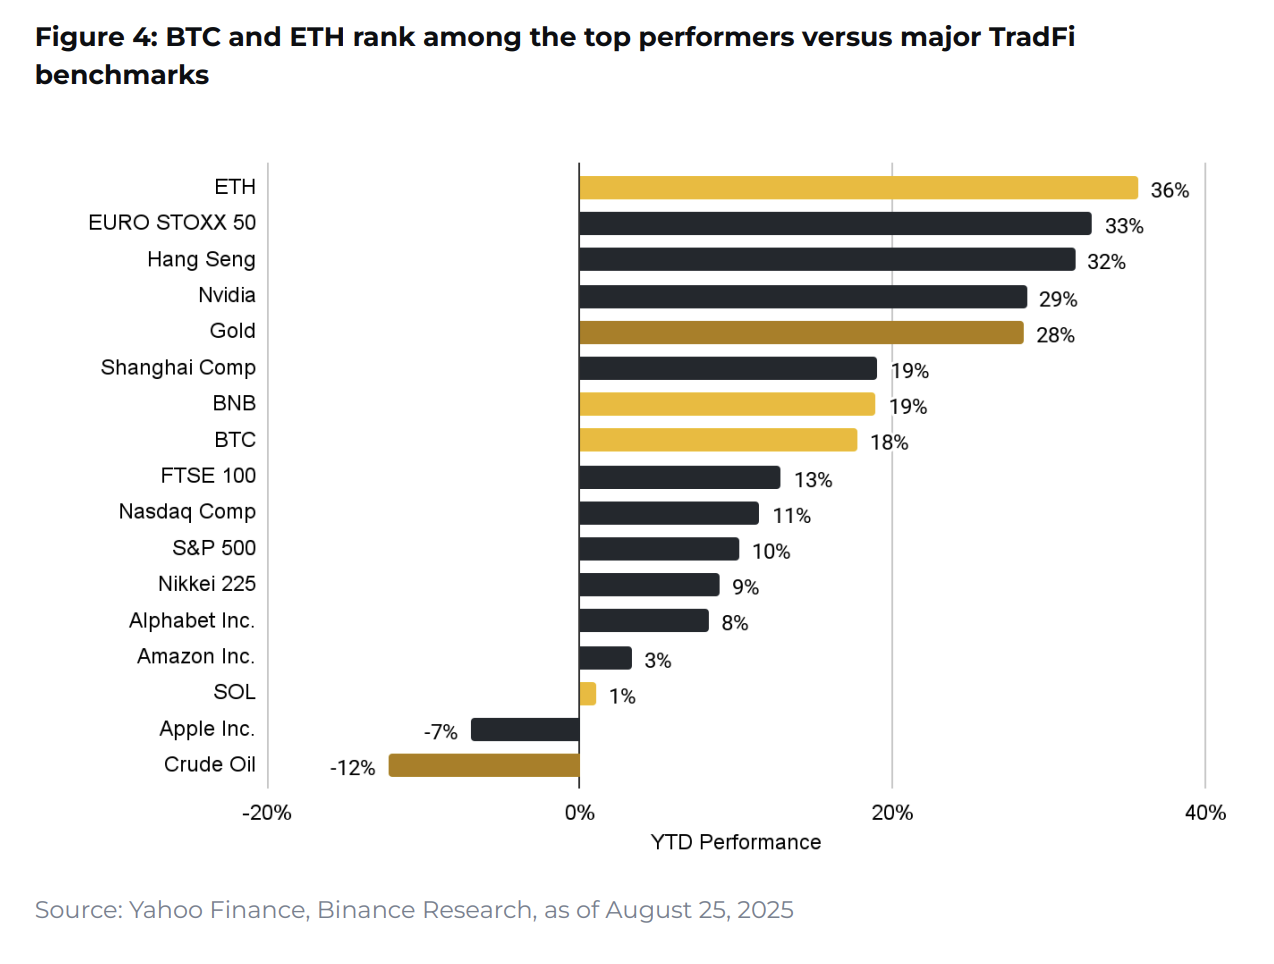
Gold remains one of the strongest traditional performers, but Bitcoin’s comparable returns with lower correlation underscore its diversification value. Together with Ethereum, these digital assets are establishing themselves as legitimate components within traditional finance portfolios.
Chart 3: ETF inflows exceed $28 billion in historic adoption wave
U.S. spot Bitcoin and Ethereum ETFs have attracted over $28 billion in net inflows during 2025, with cumulative flows since launch now exceeding $52 billion. ETF holdings have reached 1.29 million BTC (approximately $154 billion), showing institutions are finally buying in, unlike previous bull runs driven mostly by retail traders.
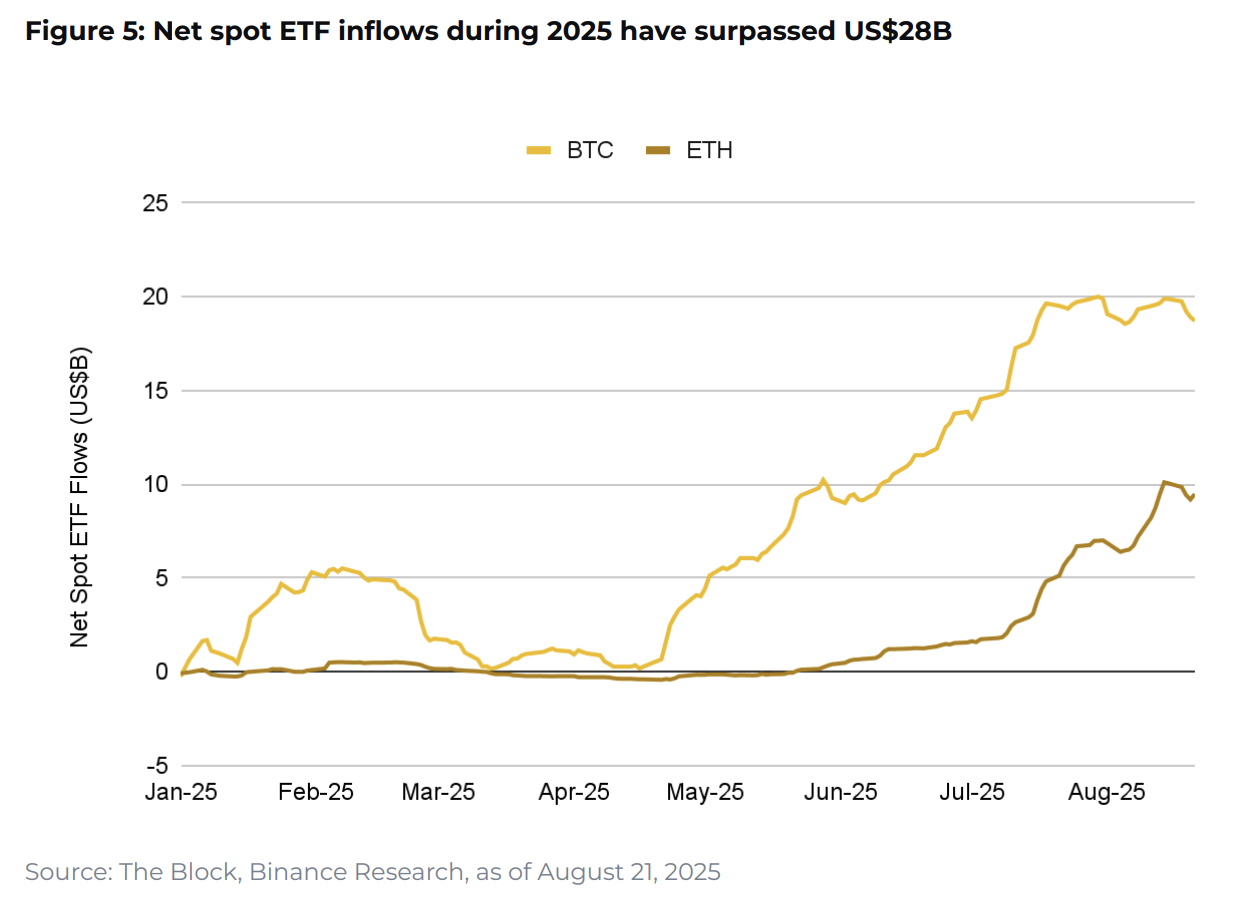
BlackRock dominates the space with over $58 billion in assets under management, significantly ahead of second-place Fidelity’s $12 billion. BlackRock is basically dominating the crypto ETF space. The recent move toward in-kind redemptions has further reduced volatility and trading friction for large allocators.
Chart 4: Bitcoin dominance signals market cycle evolution
Bitcoin dominance surged from 40% to 65.1% this year before declining to 57.2%, showing a shift from Bitcoin-led accumulation toward potential altcoin rotation. The peak dominance was driven by long-term holder accumulation, corporate treasury adoption, and deeper traditional finance integration through ETFs.
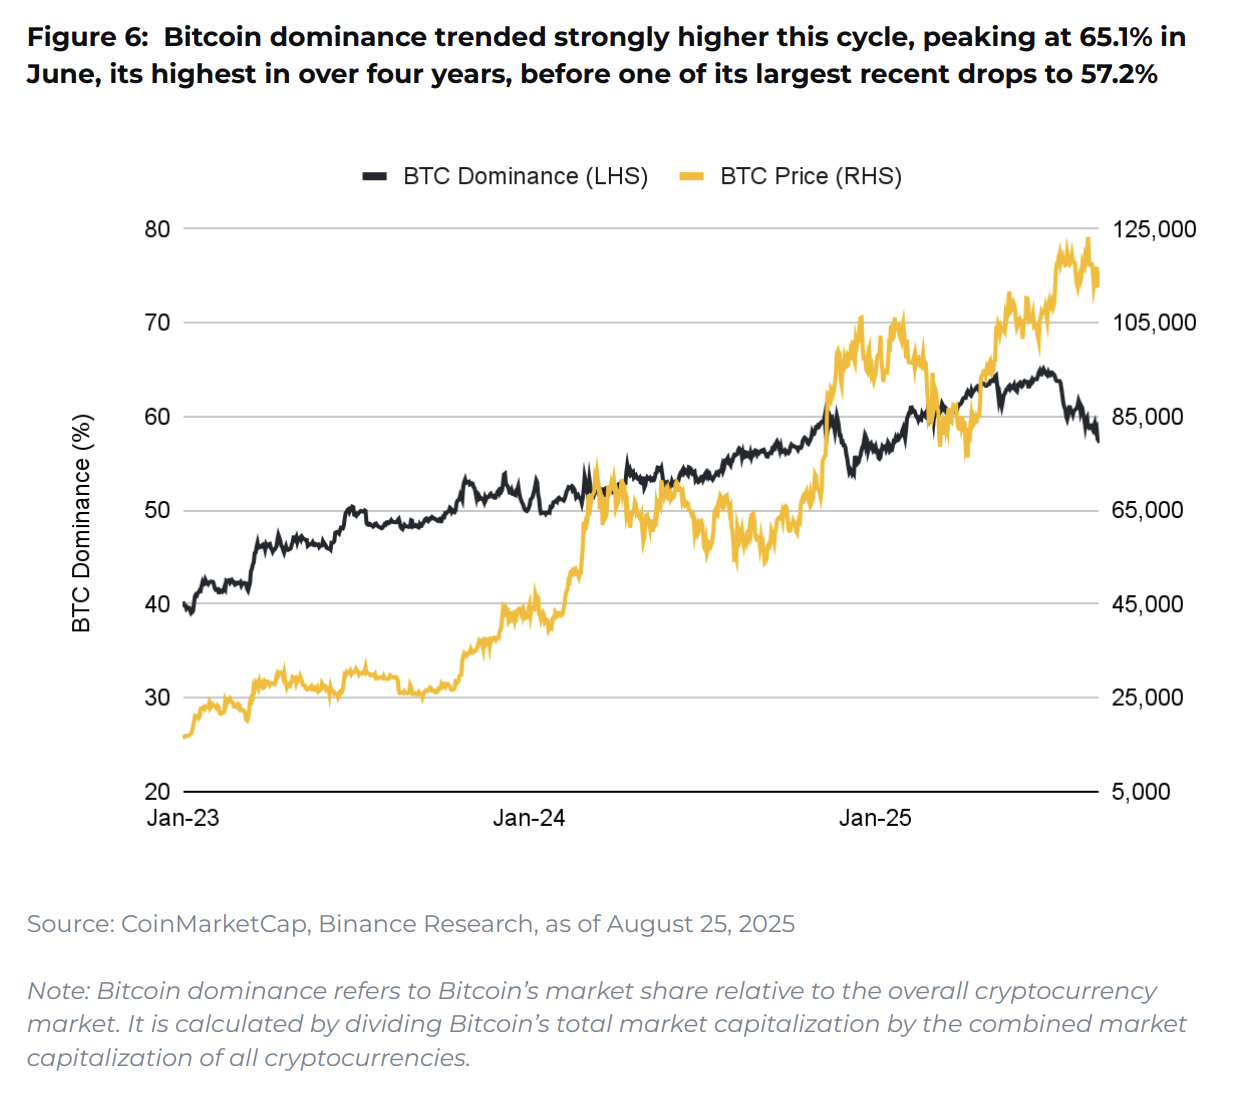
This drop could mean money is starting to flow into altcoins, which usually happens when Bitcoin cools off a bit. The balance between Bitcoin’s expanding institutional demand base and emerging altcoin flows will likely define the next market phase.
Chart 5: Ethereum staking reaches record 35.8 million ETH
Ethereum staking has climbed to historic levels, with 35.8 million ETH now staked (29.7% of total supply). The Pectra upgrade in May 2025 was a key catalyst, raising the maximum effective balance per validator from 32 ETH to 2,048 ETH through EIP-7251.
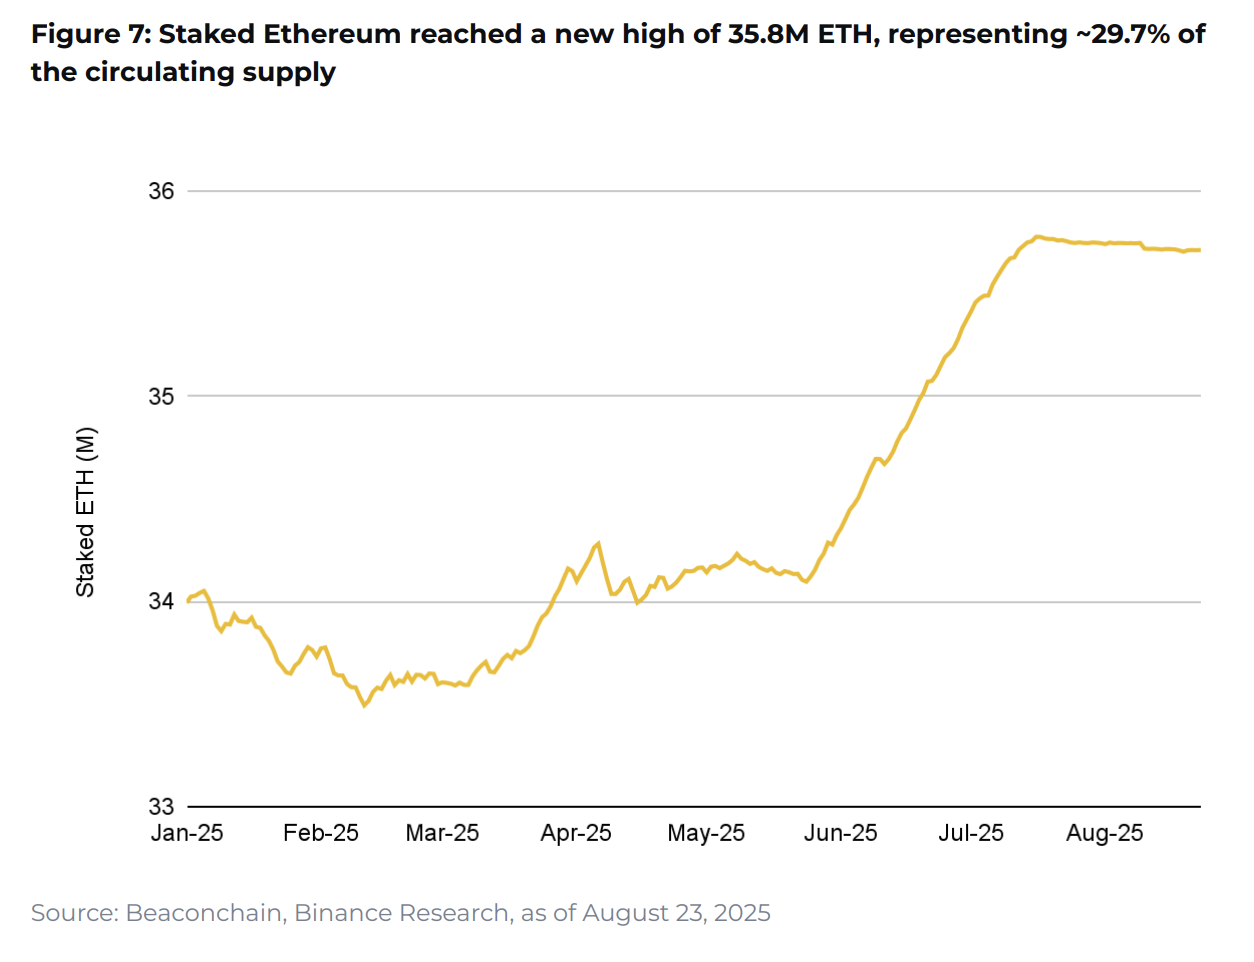
This upgrade allowed large stakers like exchanges and institutions to consolidate holdings into fewer validators, making it cheaper and easier to run. The SEC’s recent ruling that liquid staking tokens are not securities has provided additional clarity, boosting institutional confidence in staking strategies.
Chart 6: Stablecoin supply surges 35% to record $277.8 billion
Stablecoin supply has broken successive all-time highs, rising over 35% to $277.8 billion and reflecting fresh capital inflows into crypto markets. This growth signals not only increased buying power but also expanding real-world use cases beyond trading.
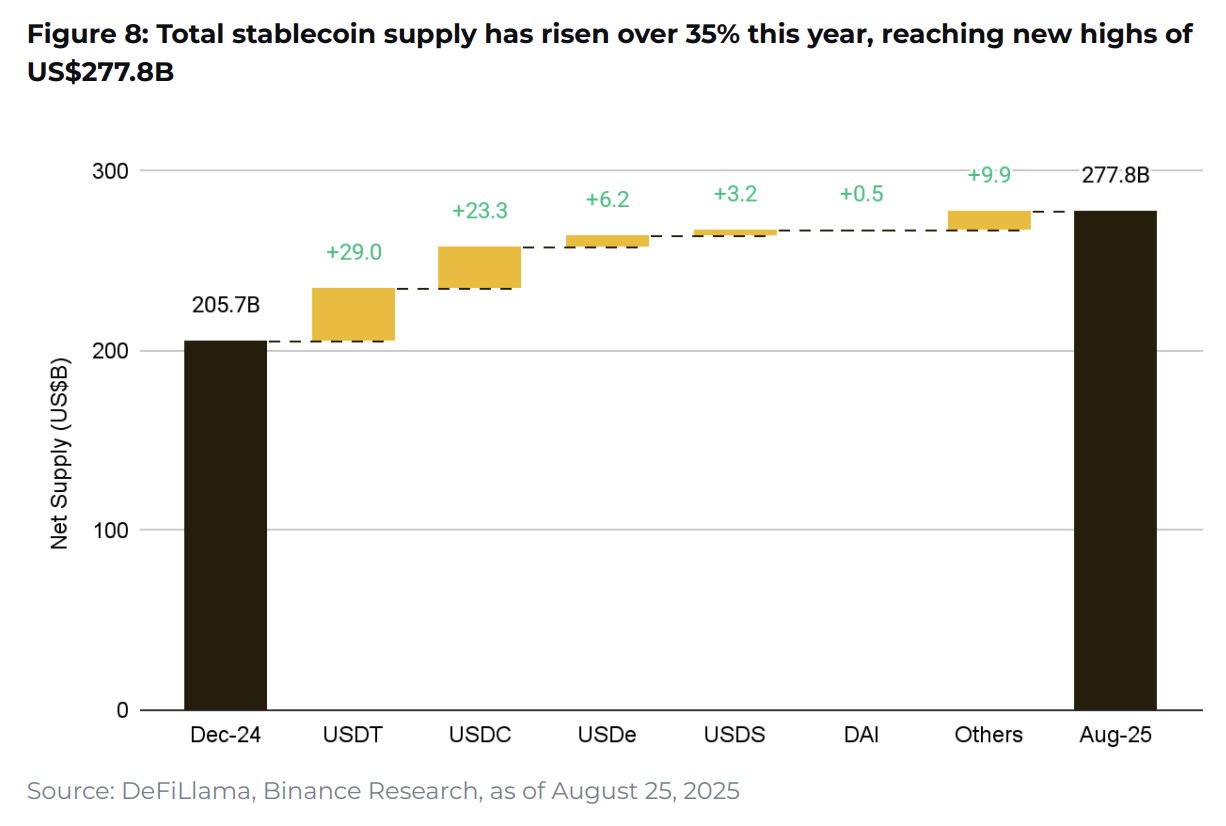
The recently passed GENIUS Act has provided regulatory clarity, requiring full reserve backing and Bank Secrecy Act compliance. This is getting more institutions comfortable using stablecoins for actual payments, not just trading, with projects like JPMorgan’s Kinexys demonstrating interbank transaction applications.
Chart 7: Corporate digital asset holdings accelerate
Public company Bitcoin holdings have reached 1.07 million BTC (5.4% of circulating supply) across 174 firms, with MicroStrategy holding approximately 59% of corporate BTC reserves. Ethereum corporate adoption is accelerating even faster, with holdings rising 88.3% in the past month to 4.36 million ETH.
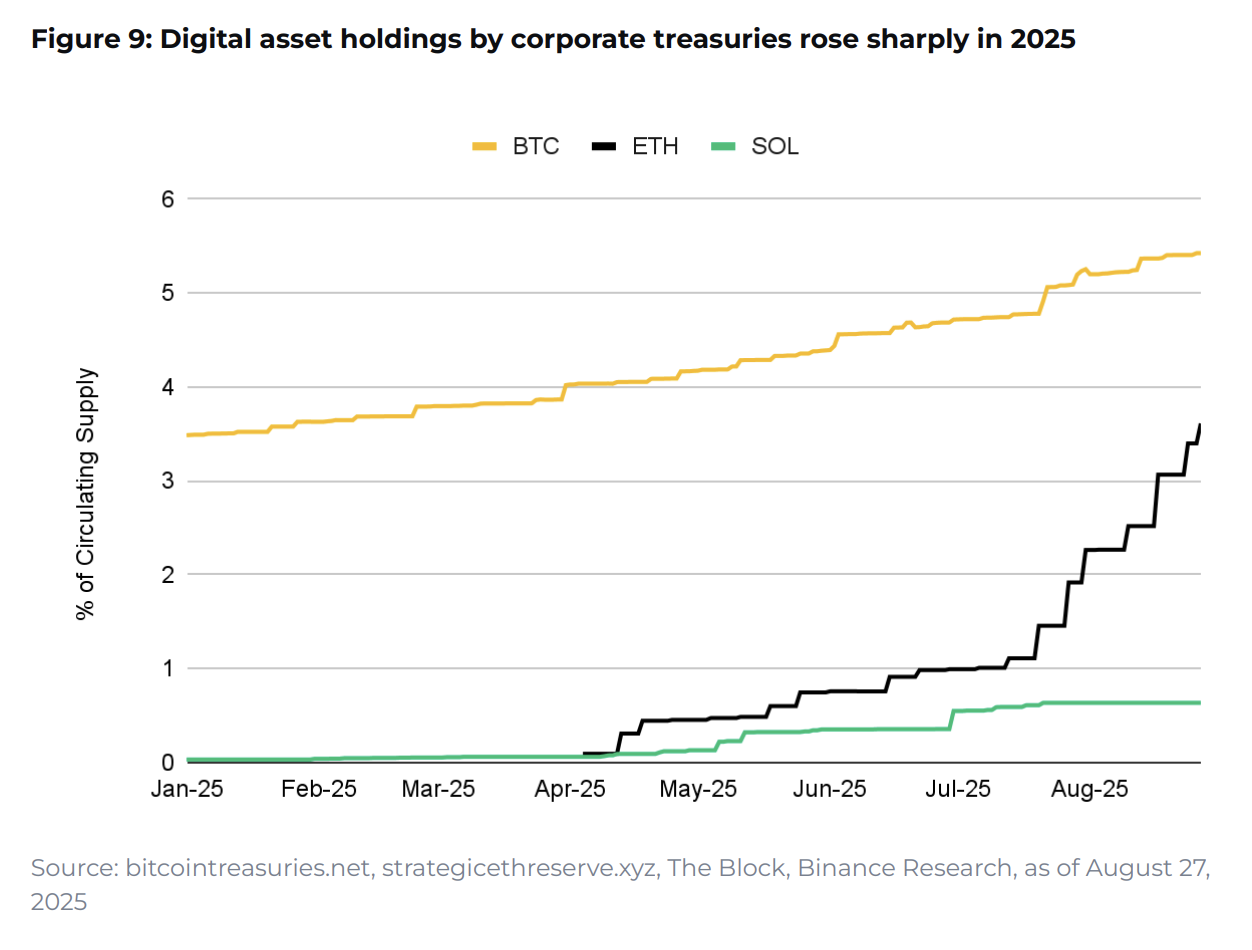
This represents the largest monthly increase on record for corporate Ethereum holdings, with over 70 entities now holding ETH collectively representing about 66% of ETF-managed ETH. Companies want to hold ETH directly instead of just buying ETFs, driven by staking yields and Ethereum’s deflationary model.
Chart 8: DEXs capture record trading market share
Decentralized exchanges have captured unprecedented market share, with spot trading reaching 23.1% and futures climbing to 9.3% of total crypto volume. DEX spot volumes more than doubled over the past year while centralized exchange volumes declined from $2.9 trillion to $1.6 trillion.
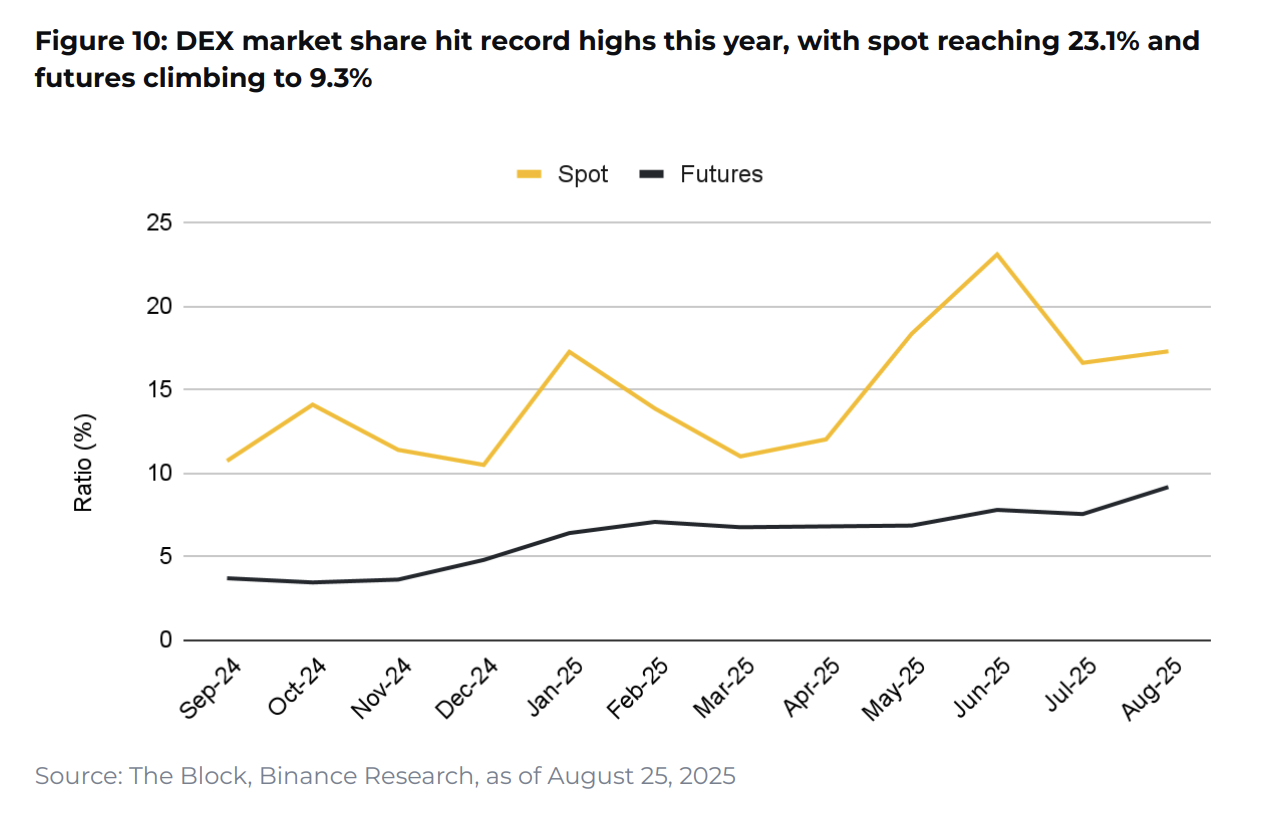
Hyperliquid drove derivatives growth, with perpetual volume rising from $197.9B in January to nearly $360.3B by August. PancakeSwap has driven significant spot volume growth, increasing its share from 4% to 16% through Alpha trading and the Infinity upgrade improvements.
Chart 9: On-chain lending shifts to active utilization
DeFi lending total value locked has climbed 65% to $79.8 billion, while borrowing activity surged 80%, indicating a shift from passive growth to active capital deployment. People are actually borrowing and lending crypto now, not just parking it in protocols.
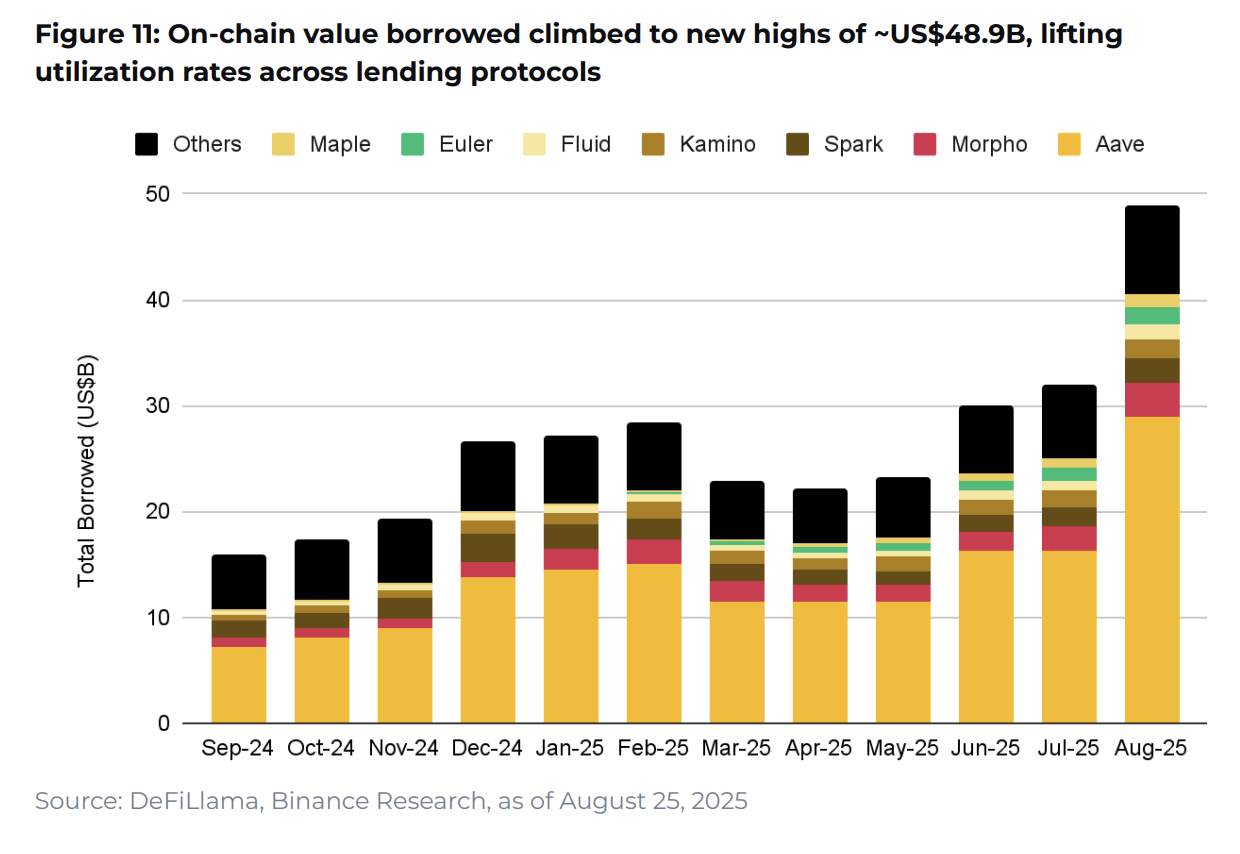
Aave maintains market leadership with $39.9 billion in TVL (50% market share) and $12.4 million in 30-day protocol fees. New entrants like Morpho, Euler, and Maple are pushing modular and real-world asset-focused architectures, letting different types of investors find lending options that work for them.
Chart 10: Tokenized stocks mirror early DeFi growth patterns
Tokenized equities have reached a $349 million market cap, supported by improved infrastructure, new trading venues, and clearer regulatory guidance. Assets like TSLA and SPY have grown over 378% since July, signaling tokenized equities as a key driver of the broader real-world asset cycle.
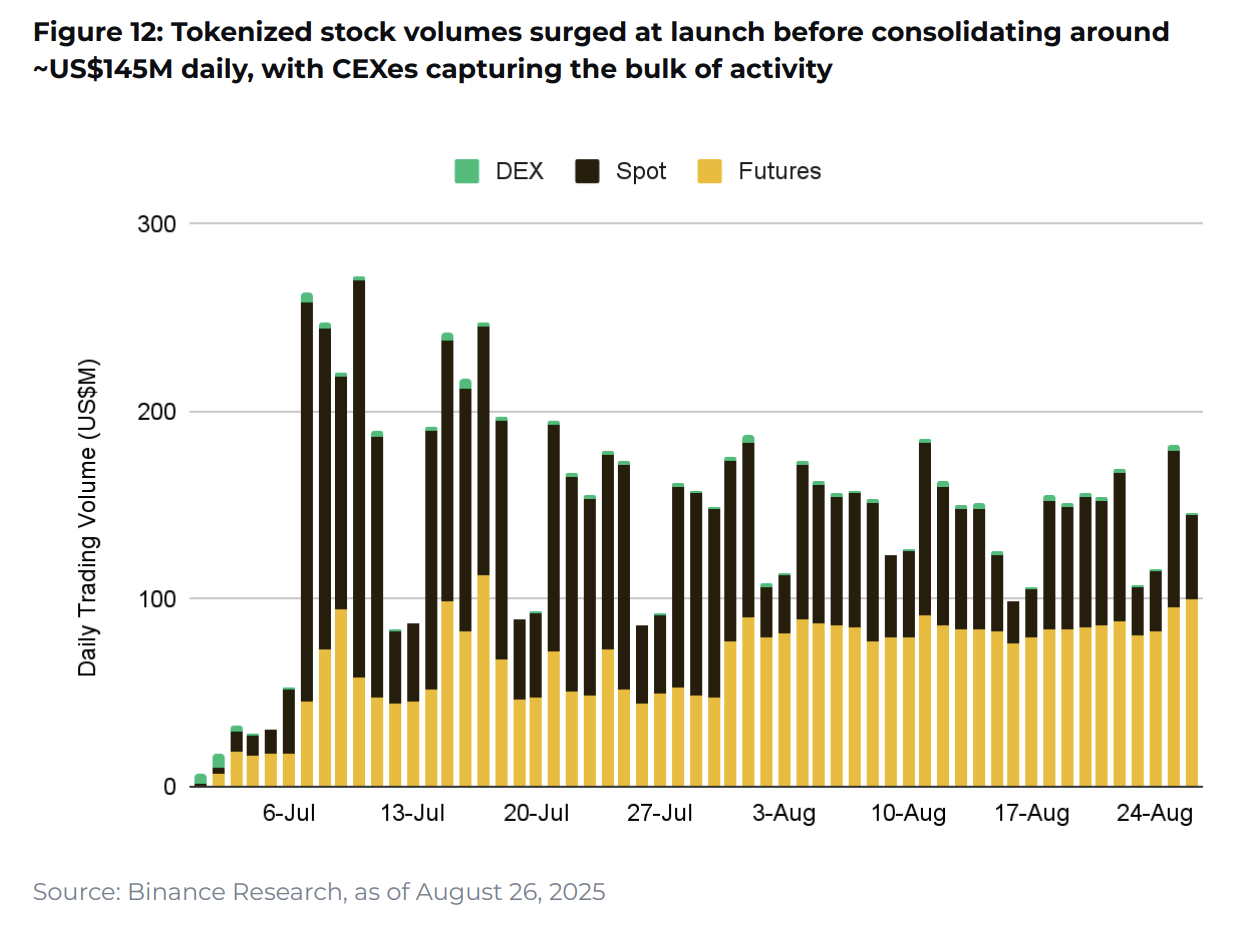
Active on-chain holders nearly tripled from 22,400 in July to over 66,500 in August, mirroring DeFi’s early adoption pattern of experimentation preceding scale. While DEX participation remains small compared to centralized exchange activity, the integration of tokenized assets into DeFi protocols is creating natural synergies for future growth.
Market outlook: Structural forces drive continued growth
ETFs, corporate buying, clearer rules, and better crypto tech are all coming together to support the market. With Bitcoin dominance declining and stablecoin reserves at record highs, the foundation exists for broader ecosystem participation.
Near-term volatility may increase with anticipated Fed rate cuts and ongoing trade tensions. It looks like crypto is growing up, with big institutions getting involved and real-world use cases taking off.
The full “10 Charts Shaping 2025” report provides detailed analysis of each trend, including technical implementations, market implications, and forward-looking insights for investors and industry participants navigating crypto’s evolving landscape.
The information published on CoinRevolution is intended solely for general knowledge and should not be considered financial advice.
While we aim to keep our content accurate and current, we make no warranties regarding its completeness, reliability, or precision. CoinRevolution bears no responsibility for any losses, errors, or decisions made based on the material provided. Always do your own research before making financial choices, and consult with a qualified professional. For more details, refer to our Terms of Use, Privacy Policy, and Disclaimers.
Articles by this author